Defining Governed Business Metrics with Unity Catalog Metric Views
- Unity Catalog
- Metric Views
- Governance
- Databricks
As data platforms evolve, the need for centrally governed, reusable, and flexible metric definitions becomes critical. Databricks addresses this challenge with Unity Catalog Metric Views - a powerful feature that allows you to define business metrics declaratively in YAML, store them under Unity Catalog, and query them via SQL with full governance and reusability.
What Are Metric Views?
Metric Views allow data teams to define semantic models - reusable business metrics that can be consistently queried and shared. These definitions:
- Are written in YAML
- Are saved and secured in Unity Catalog
- Include dimensions (categorical fields) and measures (aggregated values)
- Support filters, joins, and window functions
This approach brings a governed semantic layer to the Lakehouse, similar to what dedicated BI semantic tools provide, but natively inside Databricks.
Key Benefits
- Single source of truth for business logic
- Governance and access control via Unity Catalog
- Dynamic slicing by dimensions at query time
- Central reuse across dashboards, notebooks, and Genie
- Window and star schema support via YAML
Creating Metric Views
Method 1: Catalog Explorer (UI)
- Go to Catalog Explorer in your Databricks workspace
- Navigate to your target catalog and schema
- Click + Create → Metric View
- Paste your YAML definition
- Click Create to publish the Metric View
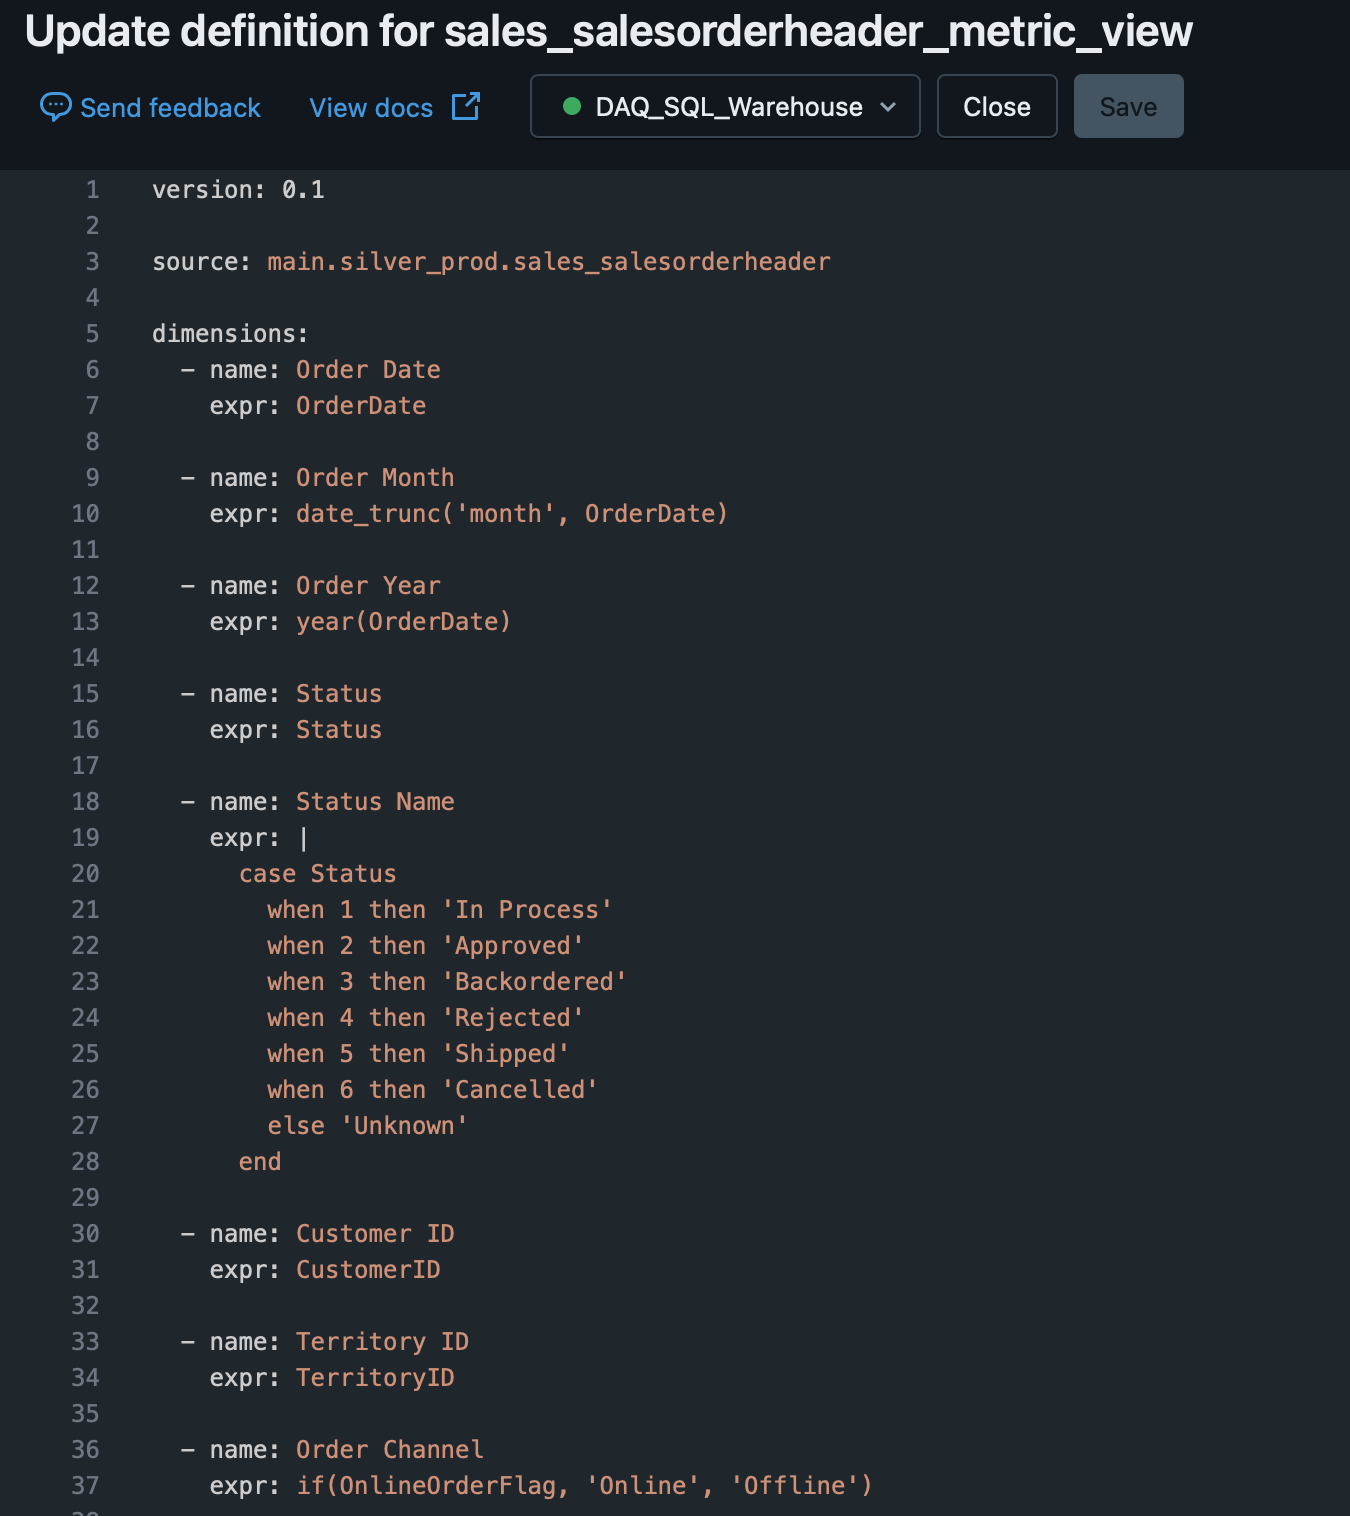
Sample YAML for Sales Metrics
version: 0.1
source: main.silver_prod.sales_salesorderheader
dimensions:
  - name: Order Date
    expr: OrderDate
- name: Order Month
    expr: date_trunc('month', OrderDate)
- name: Order Year
    expr: year(OrderDate)
- name: Status
    expr: Status
- name: Status Name
    expr: |
      CASE Status
        WHEN 1 THEN 'In Process'
        WHEN 2 THEN 'Approved'
        WHEN 3 THEN 'Backordered'
        WHEN 4 THEN 'Rejected'
        WHEN 5 THEN 'Shipped'
        WHEN 6 THEN 'Cancelled'
        ELSE 'Unknown'
      END
- name: Customer ID
    expr: CustomerID
- name: Territory ID
    expr: TerritoryID
- name: Order Channel
    expr: IF(OnlineOrderFlag, 'Online', 'Offline')
- name: Sales Person ID
    expr: SalesPersonID
measures:
  - name: Total Sales
    expr: SUM(SubTotal)
- name: Average Sales
    expr: AVG(SubTotal)
- name: Order Count
    expr: COUNT(*)
- name: Customer Count
    expr: COUNT(DISTINCT CustomerID)
- name: Total Revenue
    expr: SUM(TotalDue)
- name: Total Tax
    expr: SUM(TaxAmt)
- name: Total Freight
    expr: SUM(Freight)
- name: Online Order Percentage
    expr: SUM(CASE WHEN OnlineOrderFlag THEN 1 ELSE 0 END) * 100.0 / COUNT(*)
- name: Cancellation Rate
    expr: SUM(CASE WHEN Status = 6 THEN 1 ELSE 0 END) * 100.0 / COUNT(*)
- name: Avg Order Value
    expr: AVG(TotalDue)
- name: Max Order Value
    expr: MAX(TotalDue)
- name: Min Order Value
    expr: MIN(TotalDue)
Example:
Method 2: Using YAML File
- Save the YAML content to a file (e.g.,
sales_metrics.yaml) - Upload the file to Databricks Workspace
- In Catalog Explorer, select Create Metric View
- Choose your YAML file or paste the content
Querying Metric Views
Queries are executed through SQL Warehouses or notebooks. Use the MEASURE() function for any defined measures.
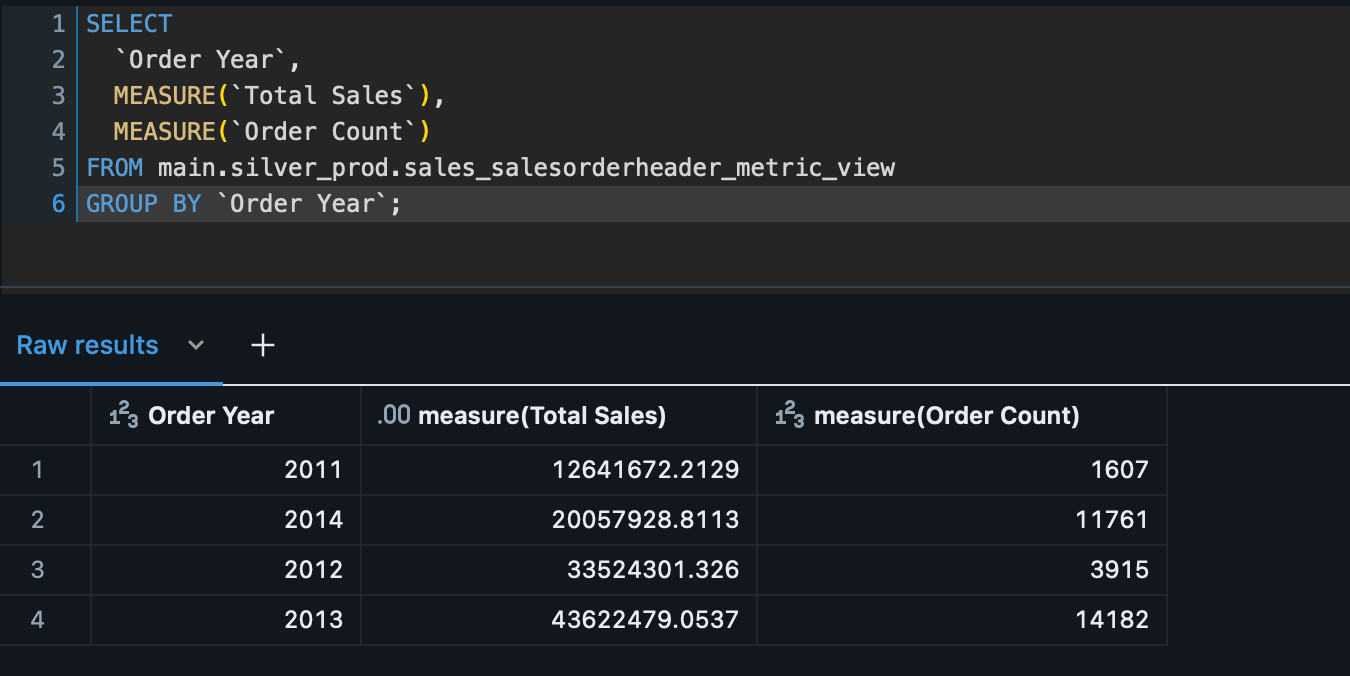
Basic Query Example
SELECT
  `Order Year`,
  MEASURE(`Total Sales`),
  MEASURE(`Order Count`)
FROM main.silver_prod.sales_salesorderheader_metric_view
GROUP BY `Order Year`;
Multi-Dimensional Analysis
SELECT
  `Order Status`,
  `Order Channel`,
  MEASURE(`Total Revenue`) AS Revenue,
  MEASURE(`Cancellation Rate`) AS CancelRate
FROM main.silver_prod.sales_metric_view
GROUP BY `Order Status`, `Order Channel`;
Important Notes:
- Use GROUP BY for all selected dimensions
- Only defined dimensions and measures can be used in queries
- The MEASURE() function is mandatory
Adding Joins (Star Schema Modeling)
Enrich metric definitions by joining with dimension tables:
joins:
  - name: customer
    source: main.silver_prod.dim_customer
    on: source.CustomerID = customer.CustomerID
dimensions:
  - name: Customer Segment
    expr: customer.CustomerSegment
Rules:
- Only LEFT OUTER JOIN is supported
- Reference base table columns with source. prefix
Window Metrics (Experimental)
Window metrics enable time-based aggregations:
measures:
  - name: Rolling 7d Revenue
    expr: SUM(TotalDue)
    window:
      - order: OrderDate
        range: trailing 7 day
Permissions and Governance
Metric Views are fully governed under Unity Catalog:
-- Grant SELECT permission on metric view
GRANT SELECT ON main.analytics.sales_metrics TO `finance_team`;
Using with Genie
In Catalog Explorer, find your metric view and click “Ask Genie Preview”. You can analyze with natural language queries:
- “Show me monthly revenue trend”
- “What is the cancellation rate by channel?”
- “Compare order volume across different statuses”
Limitations
- No SELECT * support
- No nested aggregations on MEASURE()
- Joins must be declared in YAML, not at query time
- Delta Sharing is not yet supported
- Joined tables cannot have complex data types (like MAP)
Use Cases
1. Executive Dashboards
Create unified KPIs like Revenue, Order Volume, and Cancellation Rates.
2. Self-Service Analytics
Enable analysts to query governed metrics without touching raw tables.
3. Regulatory Reporting
Ensure auditability and version control over metrics used in external reporting.
Best Practices
- Naming: Use business-friendly, clear names
- Documentation: Add descriptions for each dimension and measure
- Performance: Use filters for large tables
- Version Control: Store YAML files in Git
- Testing: Start with simple metrics, then add complexity
Conclusion
Metric Views bring the semantic layer directly into the Lakehouse architecture - governed, scalable, and declarative. By defining business logic as code, teams gain confidence in their data, reduce duplication, and accelerate dashboard development.
Start simple: pick your most-used fact table, define dimensions and measures, and expose it through Metric Views. You’ll quickly realize how much time and confusion you save.
Let governance and clarity start with your metrics!